一、监控系统的前世今生
1.1 监控系统发展史
SNMP 监控时代
当今的监控系统
未来的监控系统
- DataOps
- AiOps
1.2 监控系统组件
监控系统基本组件
- 指标数据采集
- 指标数据存储
- 指标数据趋势分析及可视化
- 告警
1.3 监控体系

1.4 云原生时代的可观测性

1.5 监控方法论
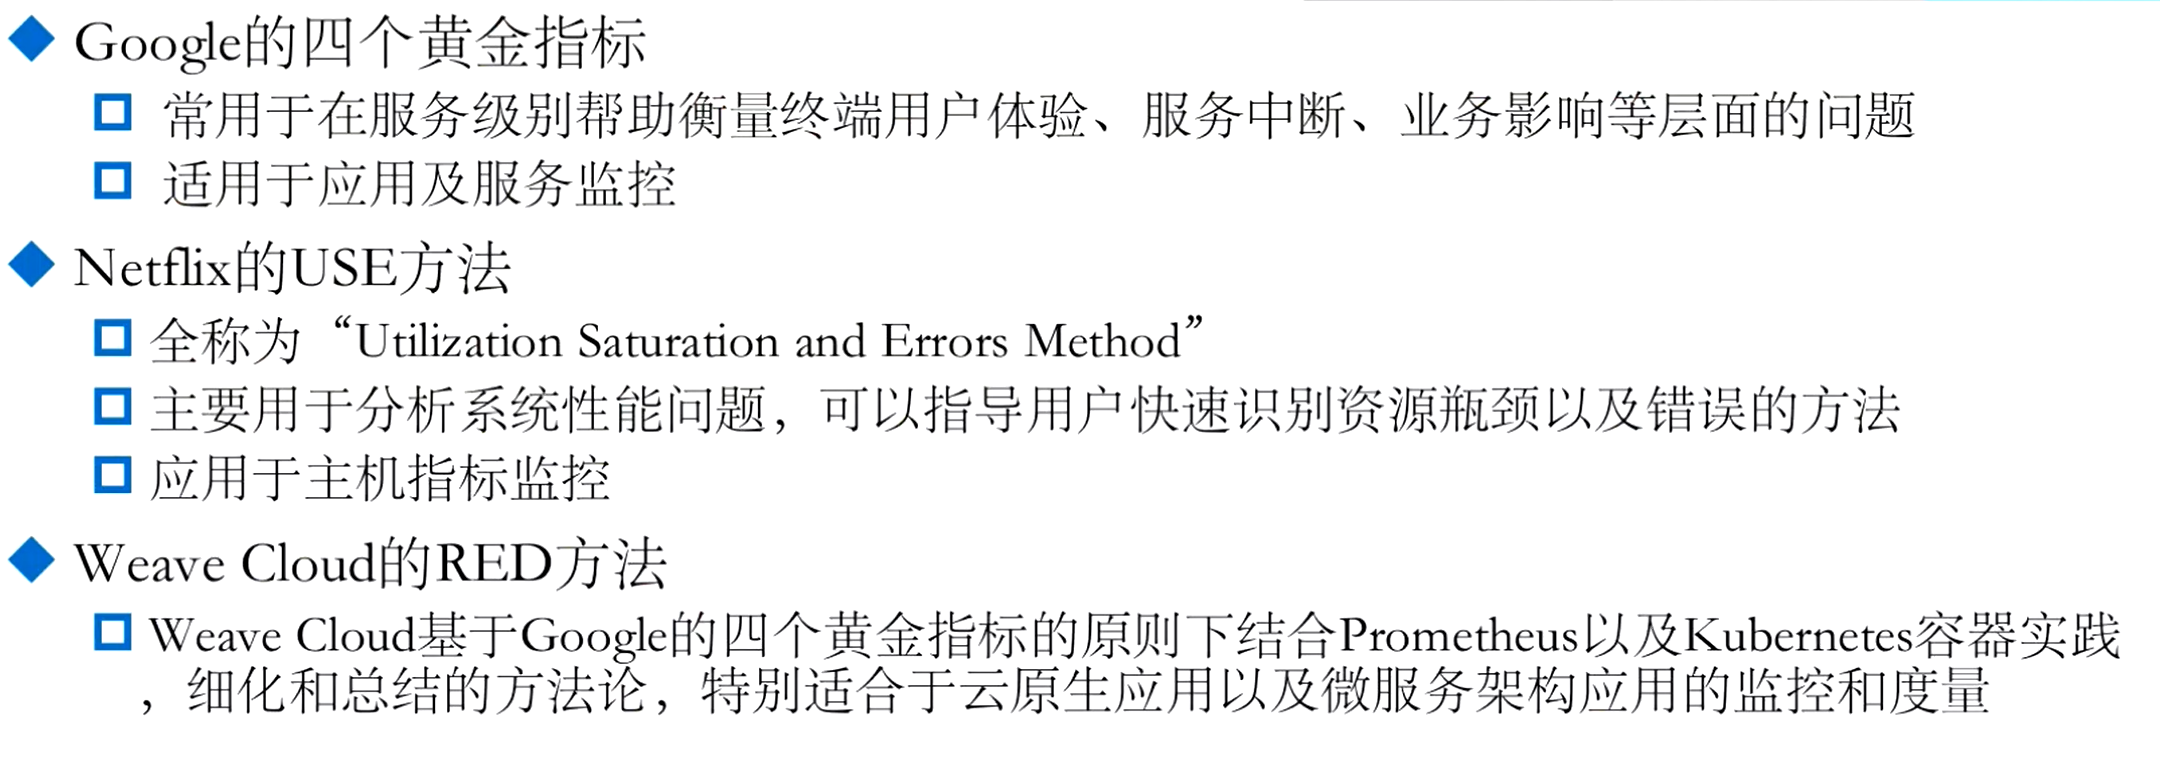
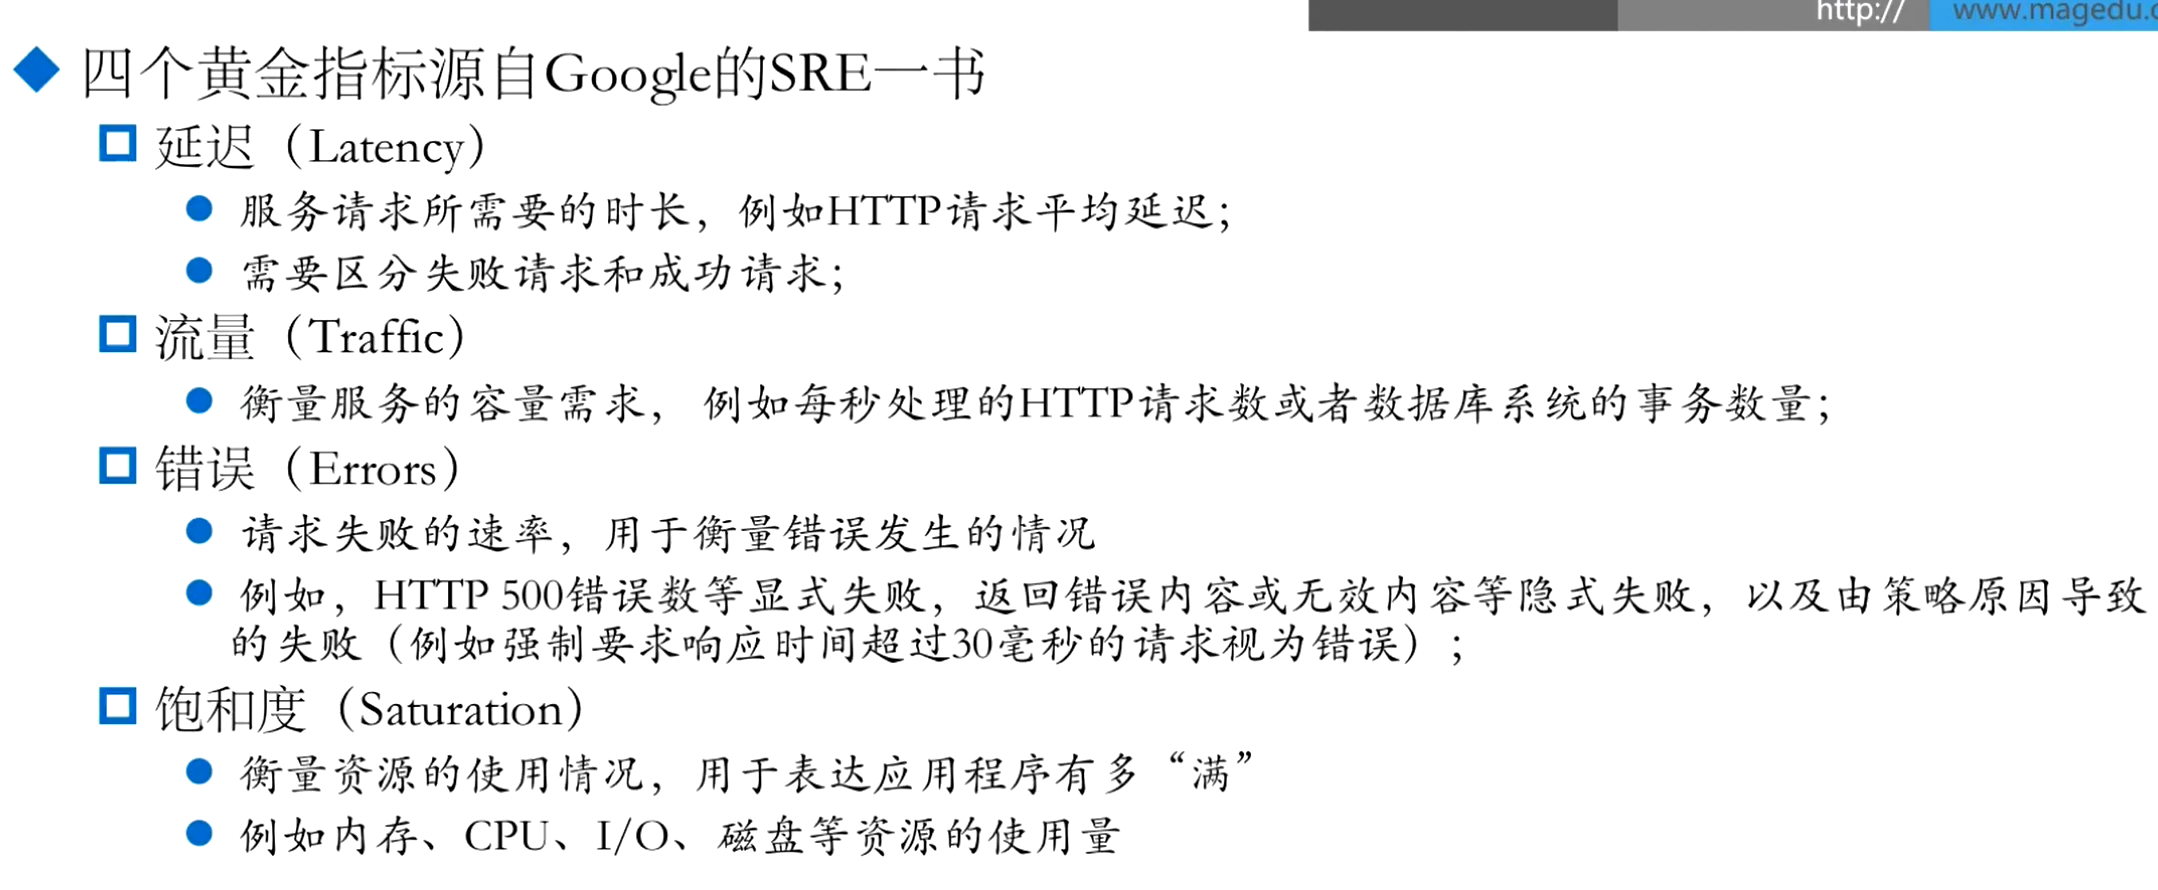
1.5.1 Google的四大黄金指标
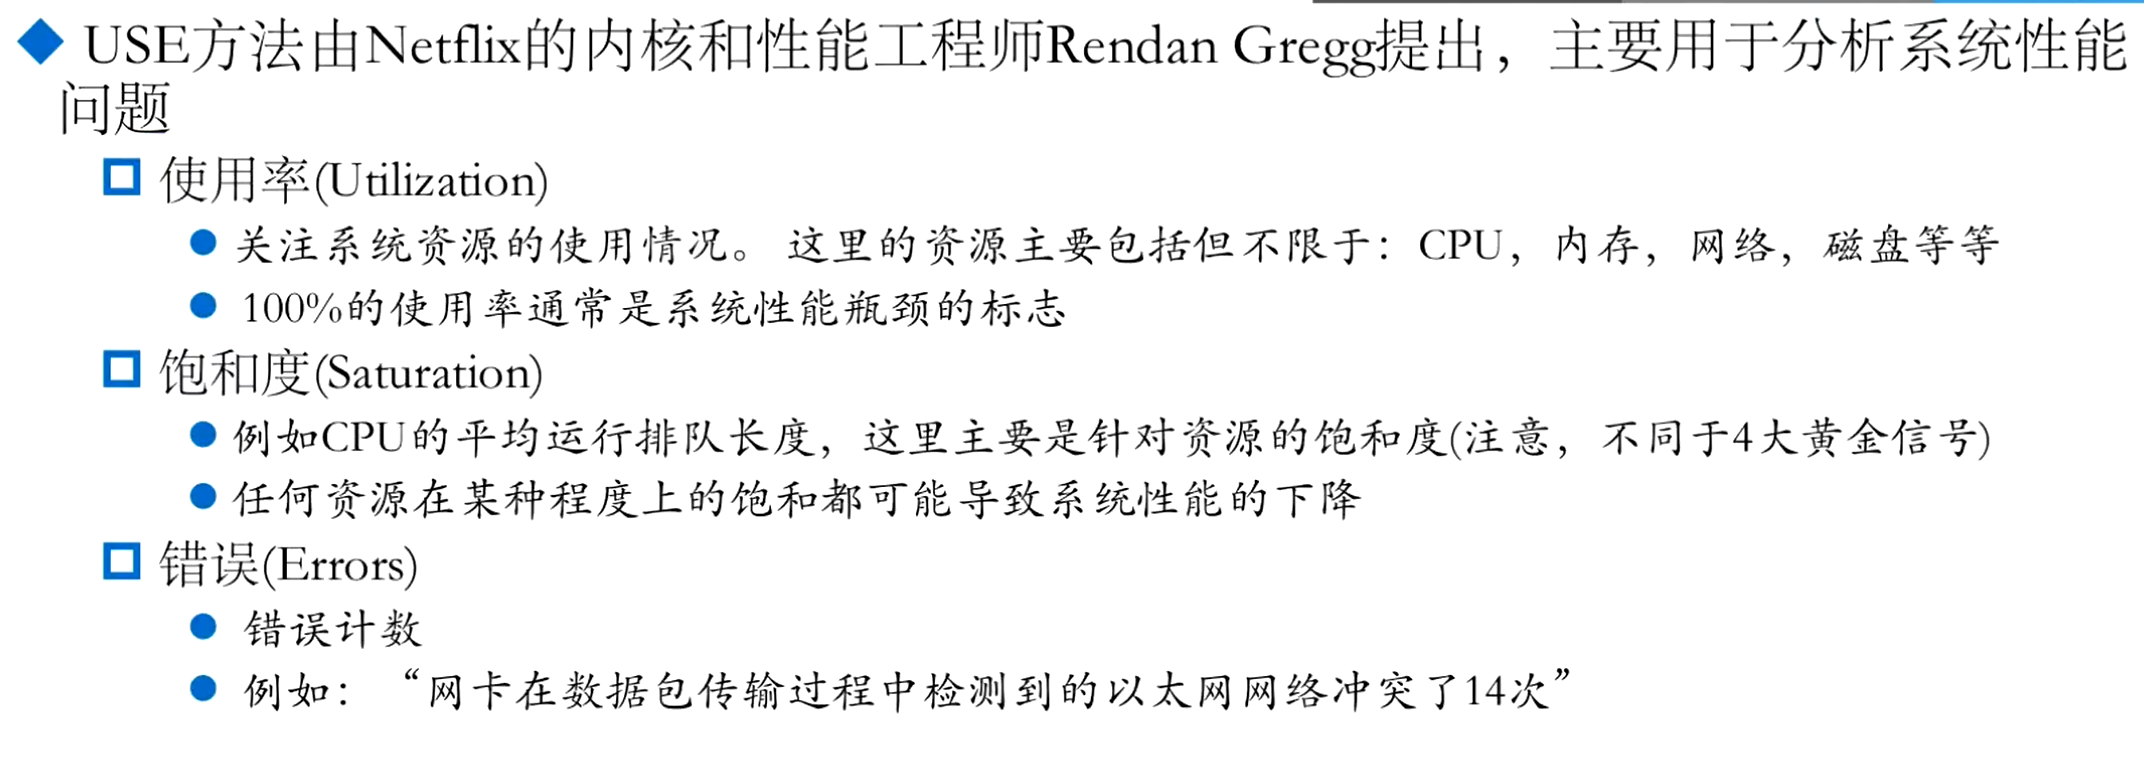
1.5.2Use 方法
1.5.3RED 方法

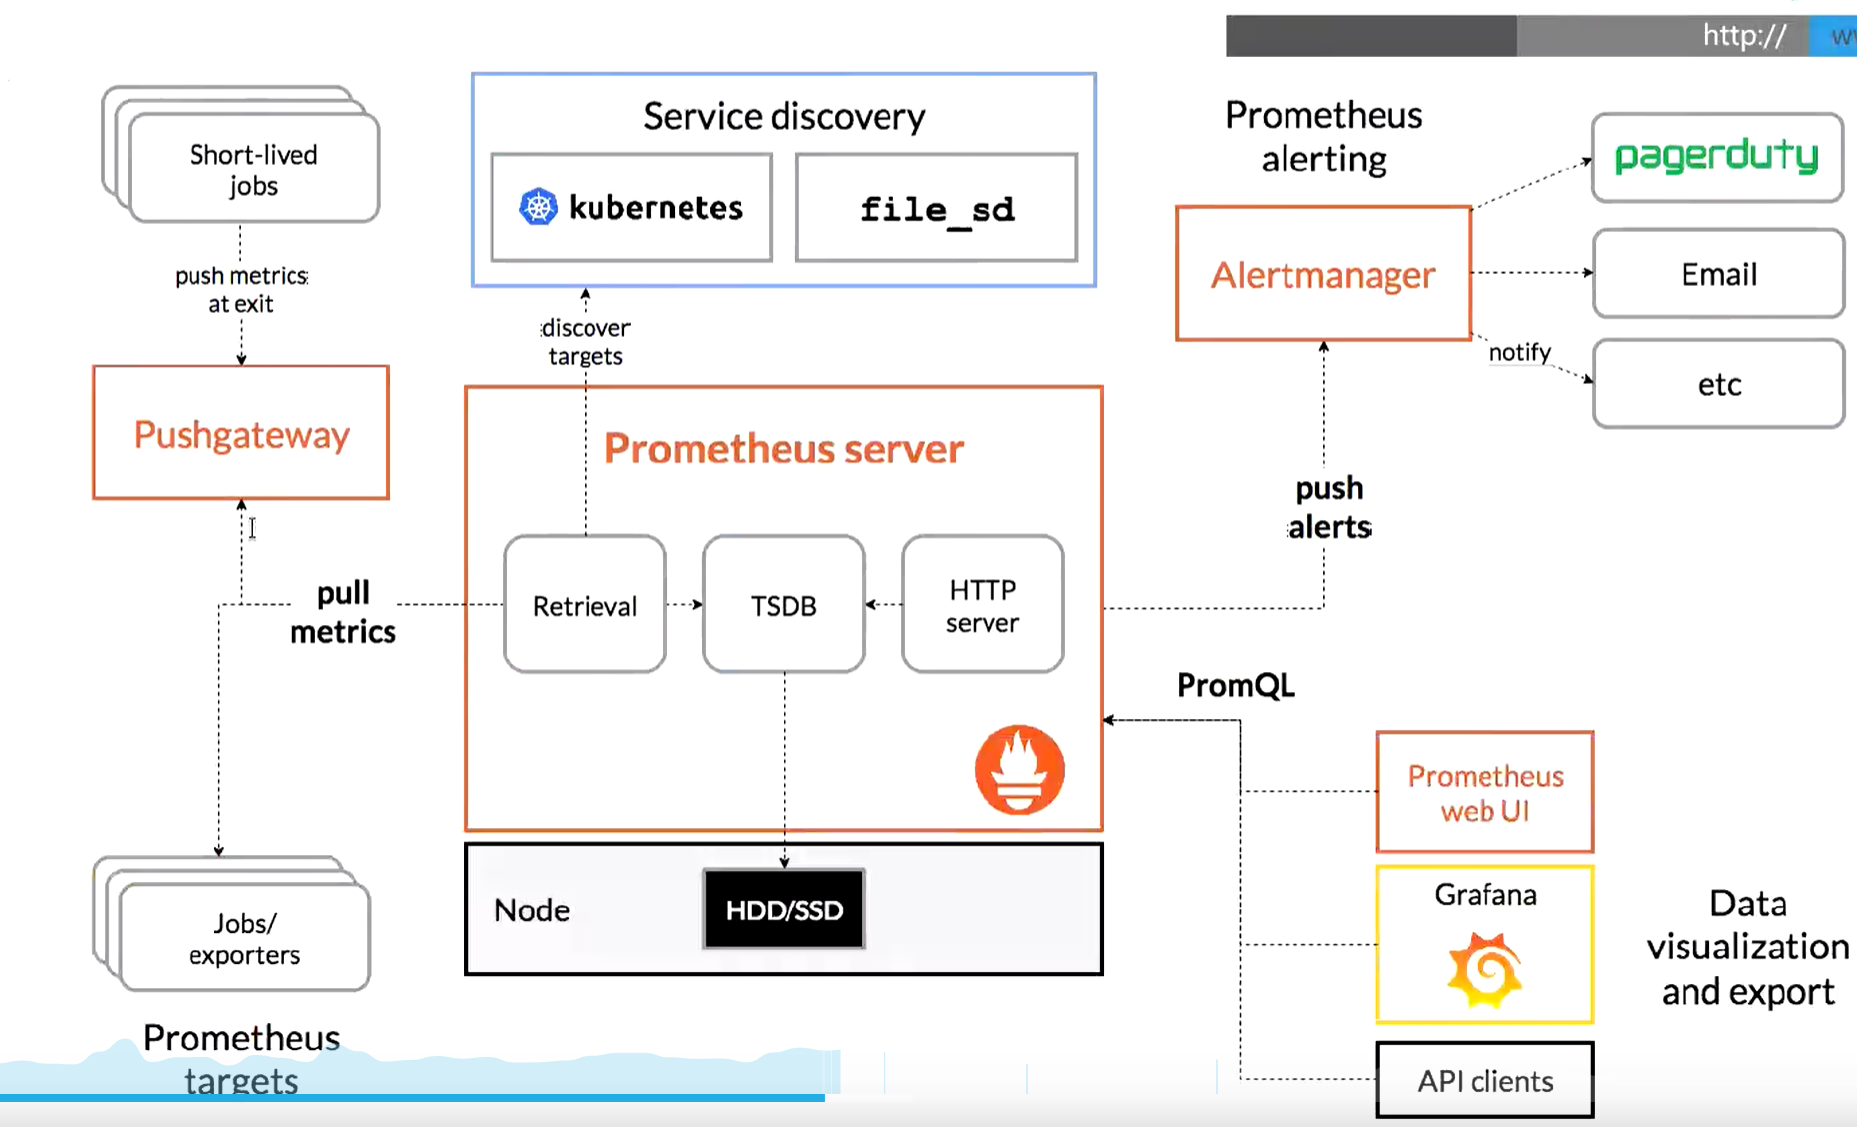
二 Prometheus 入门
2.1 prometheus 是什么
时序数据库TSDB
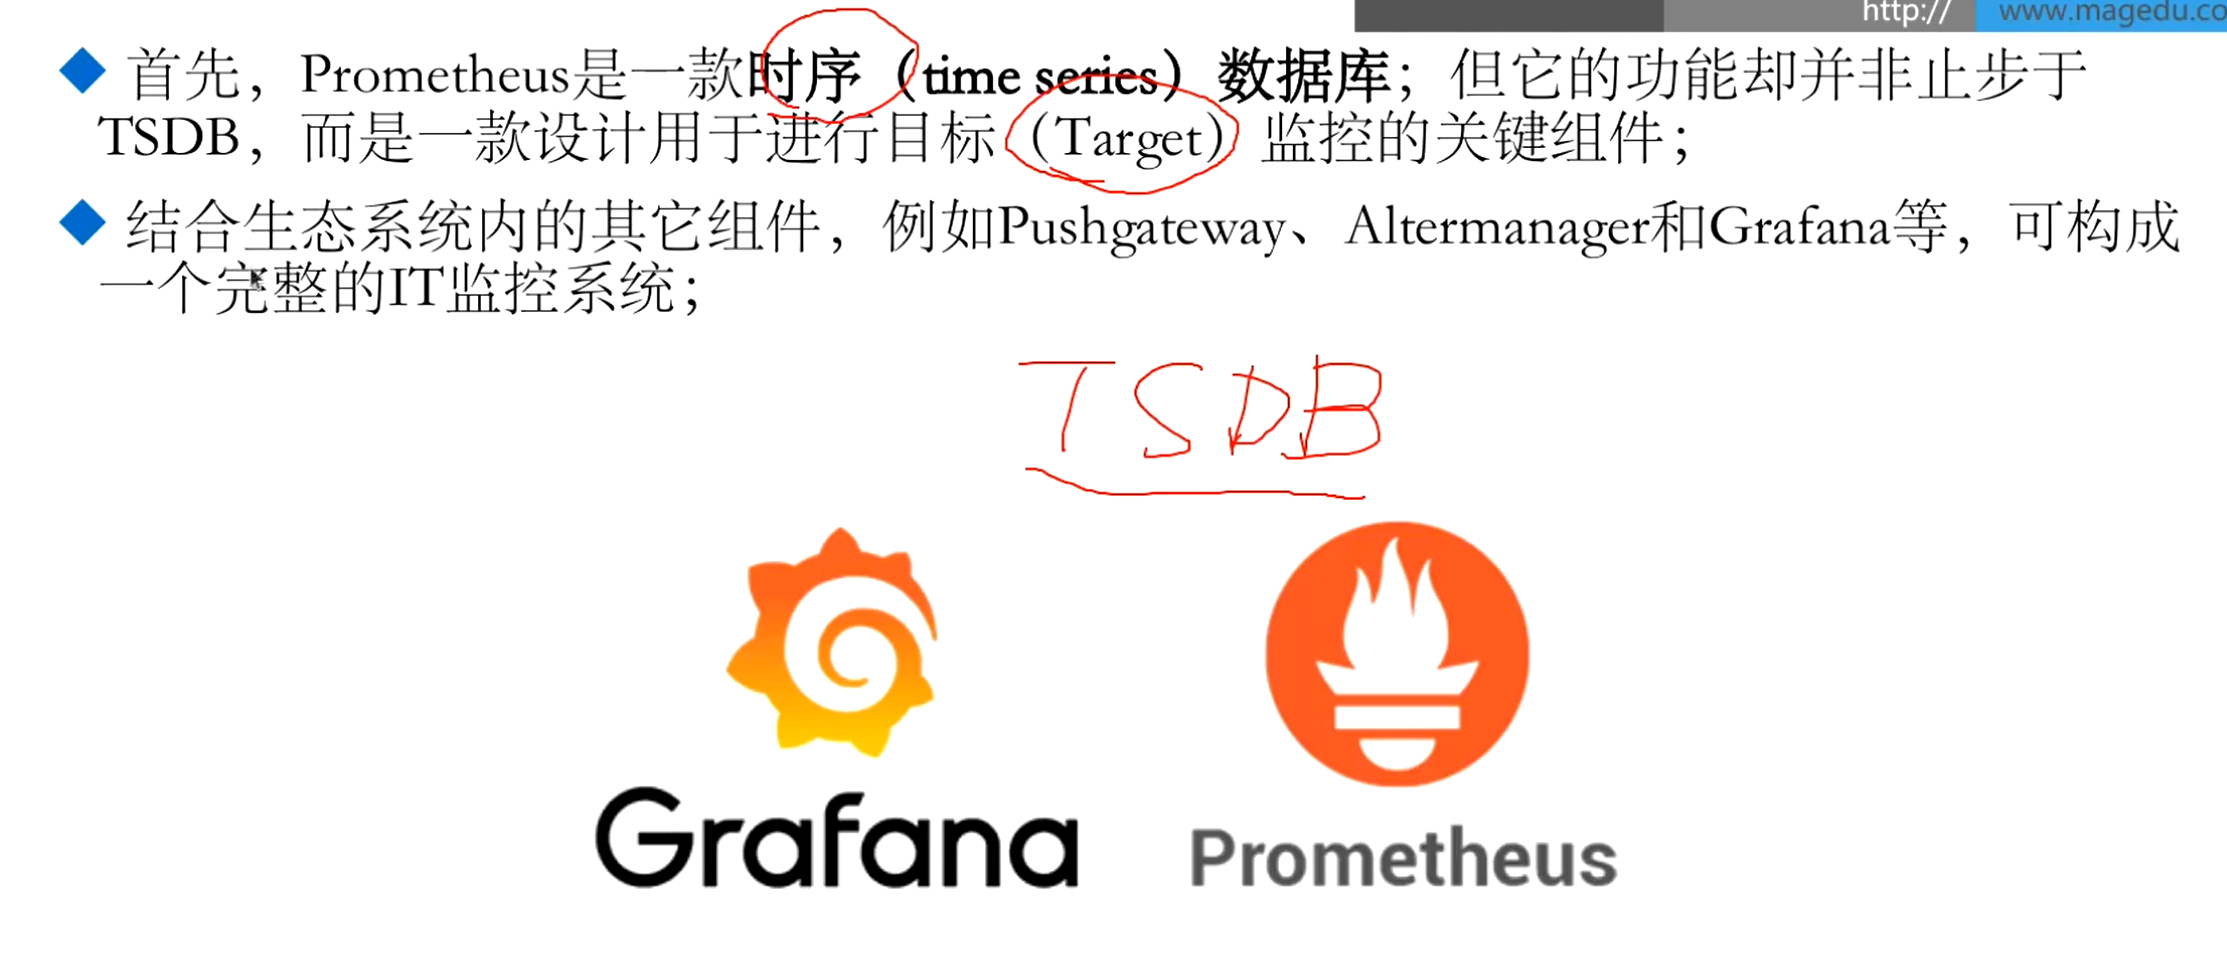
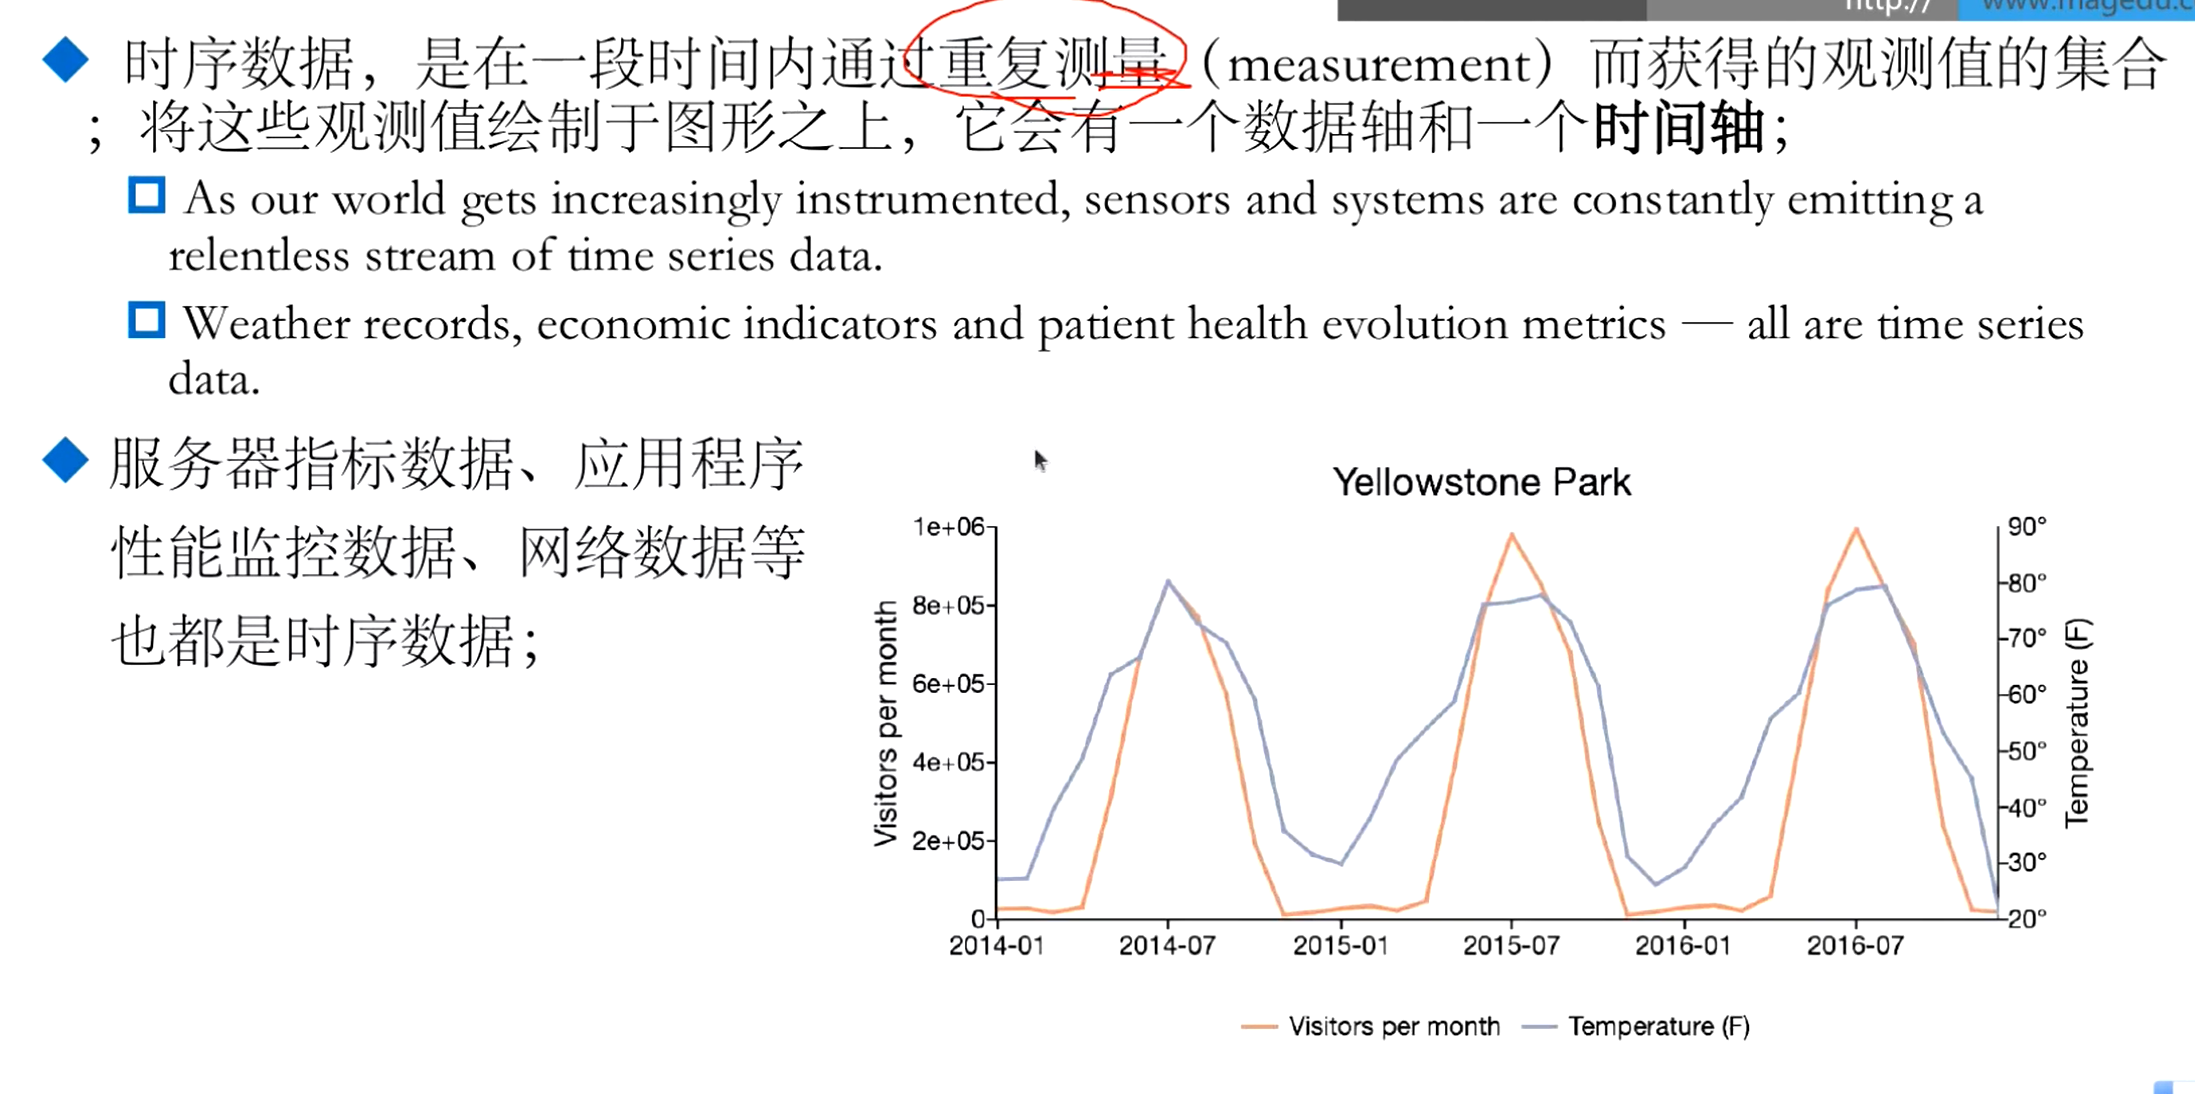
时序数据简介
prometheus do
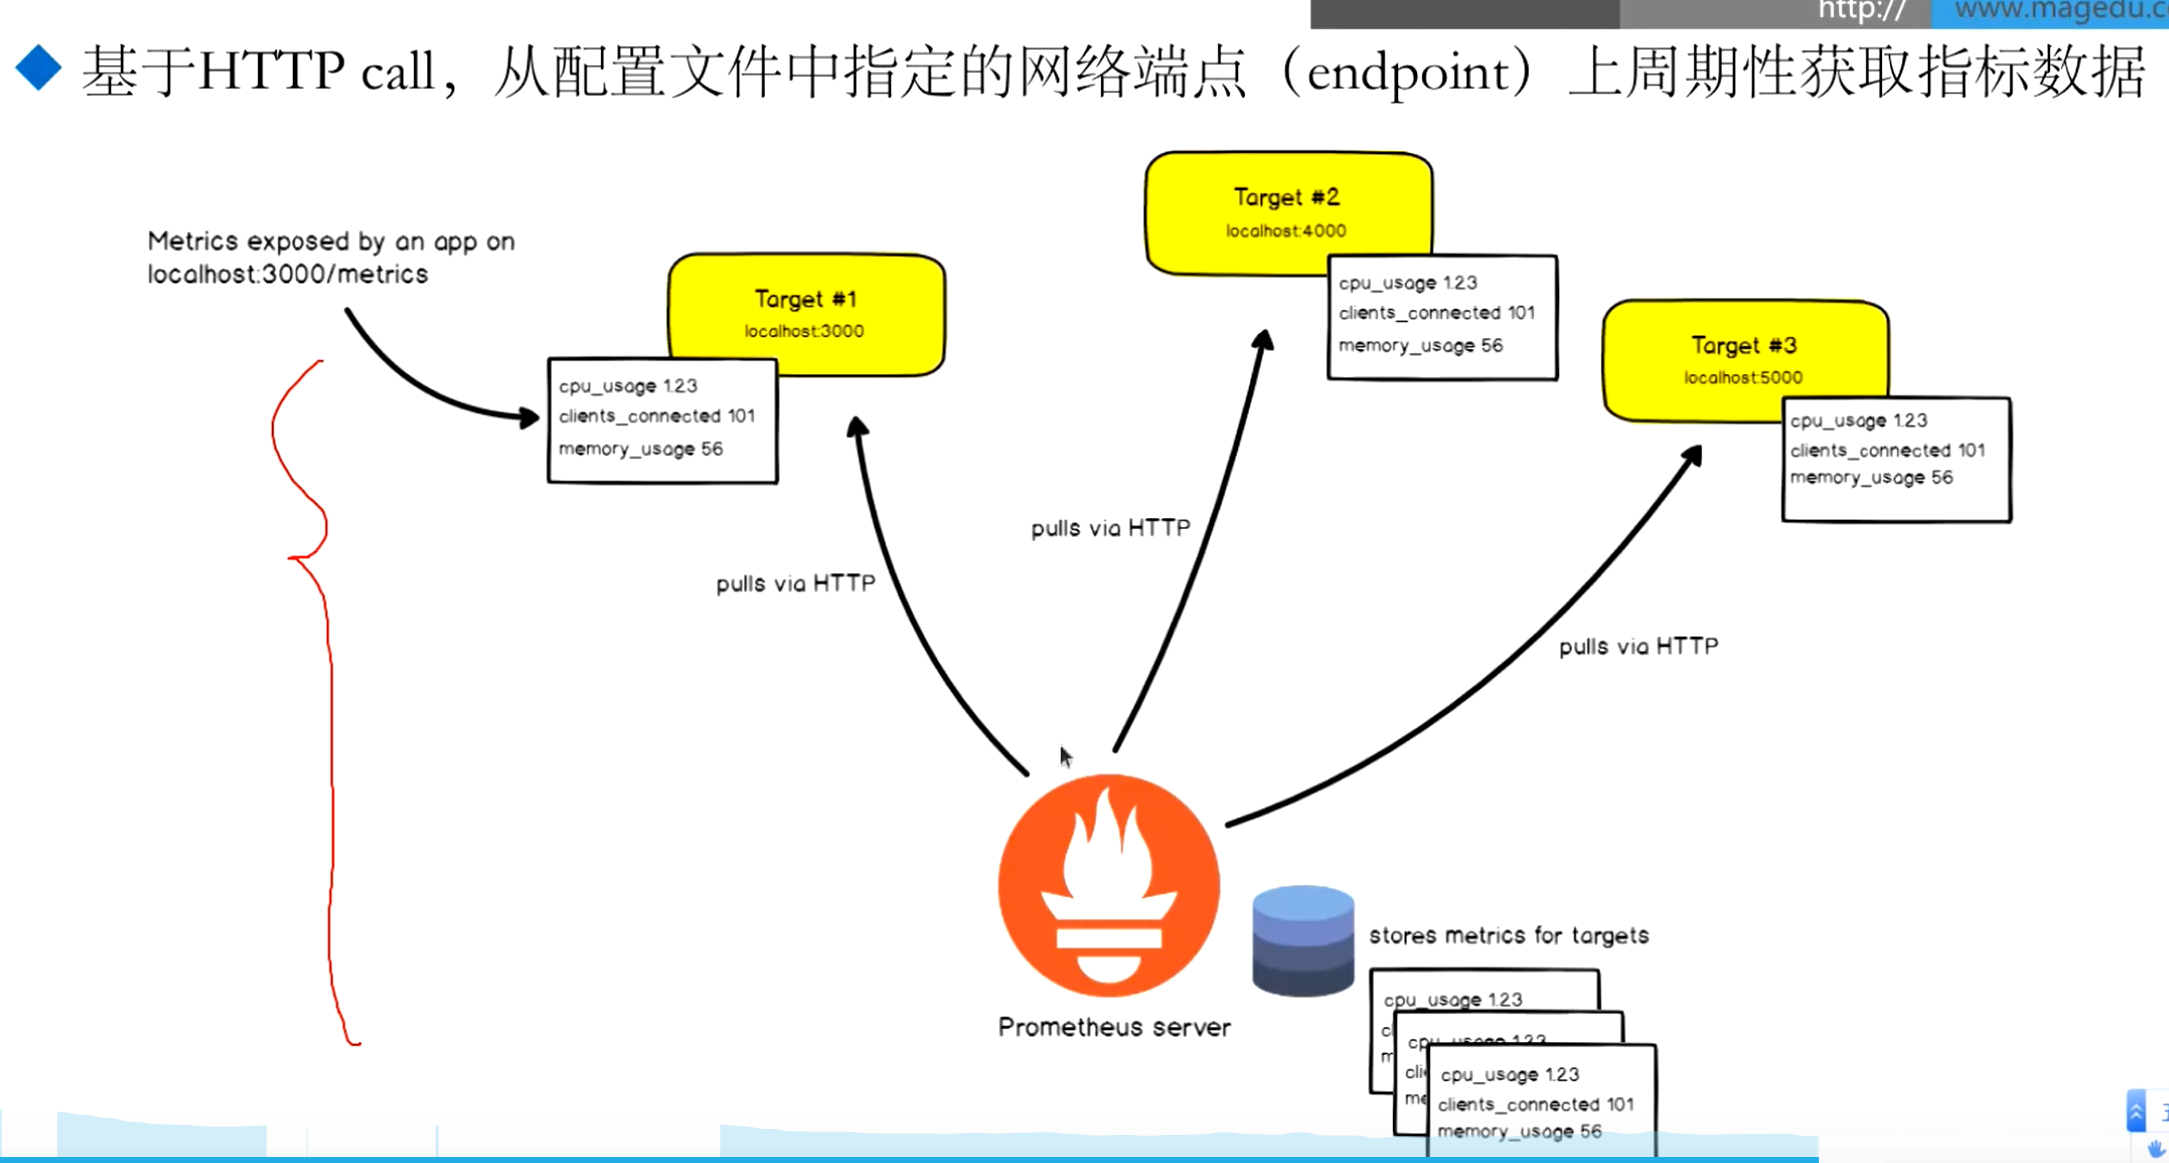
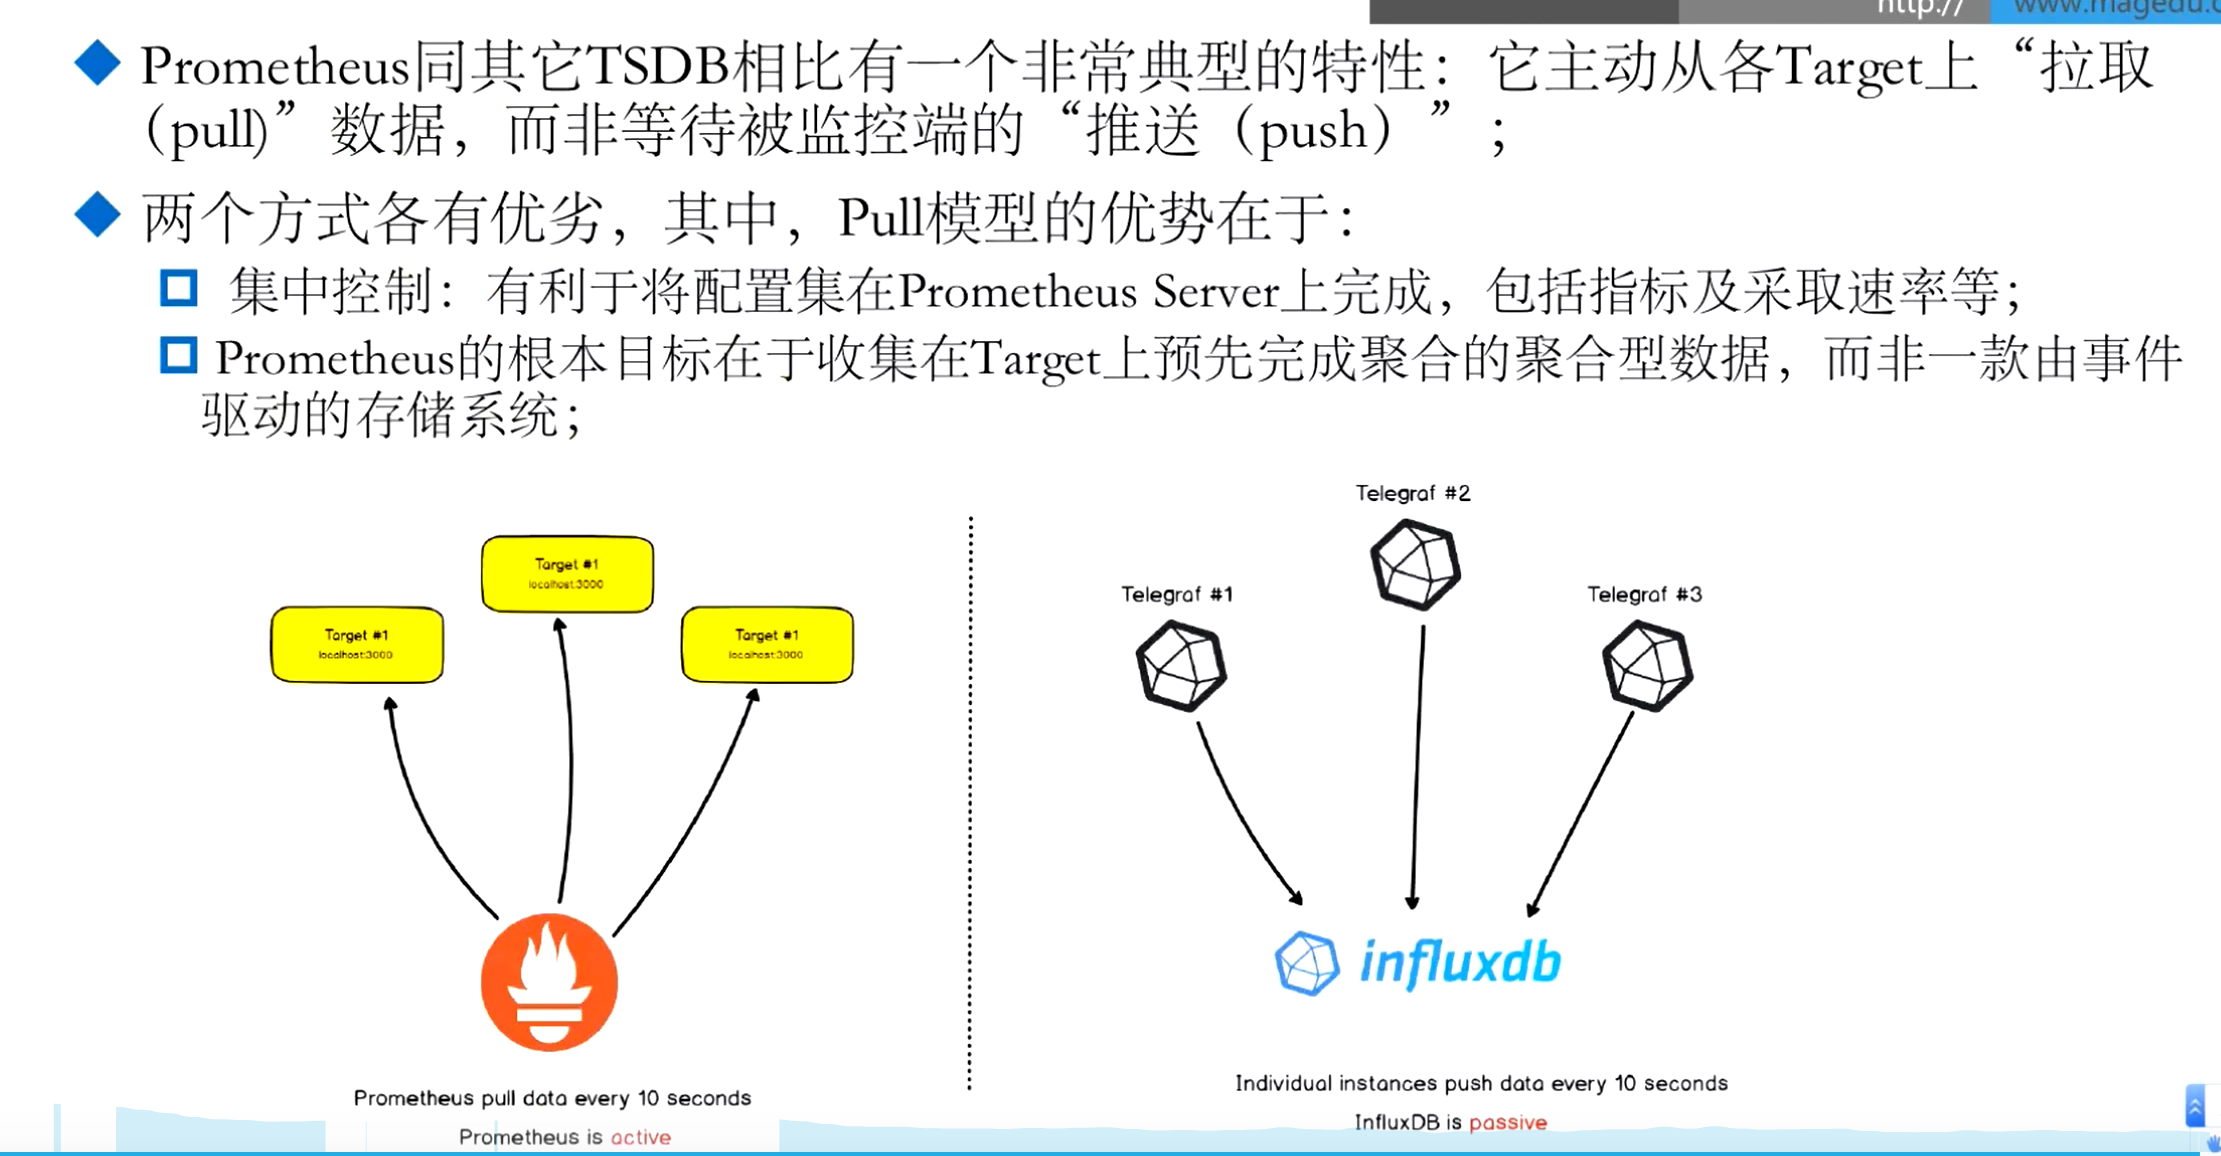
- 基于http协议
- pull 模式 作为客户端从endpoint抓取数据
白盒监控:作为一种自行方式,被监控系统内部能够自己生成指标,由监控系统采集
黑盒监控:对于目标系统没有侵入性,基于探针的方式
采用以下三种方式进行白盒监控
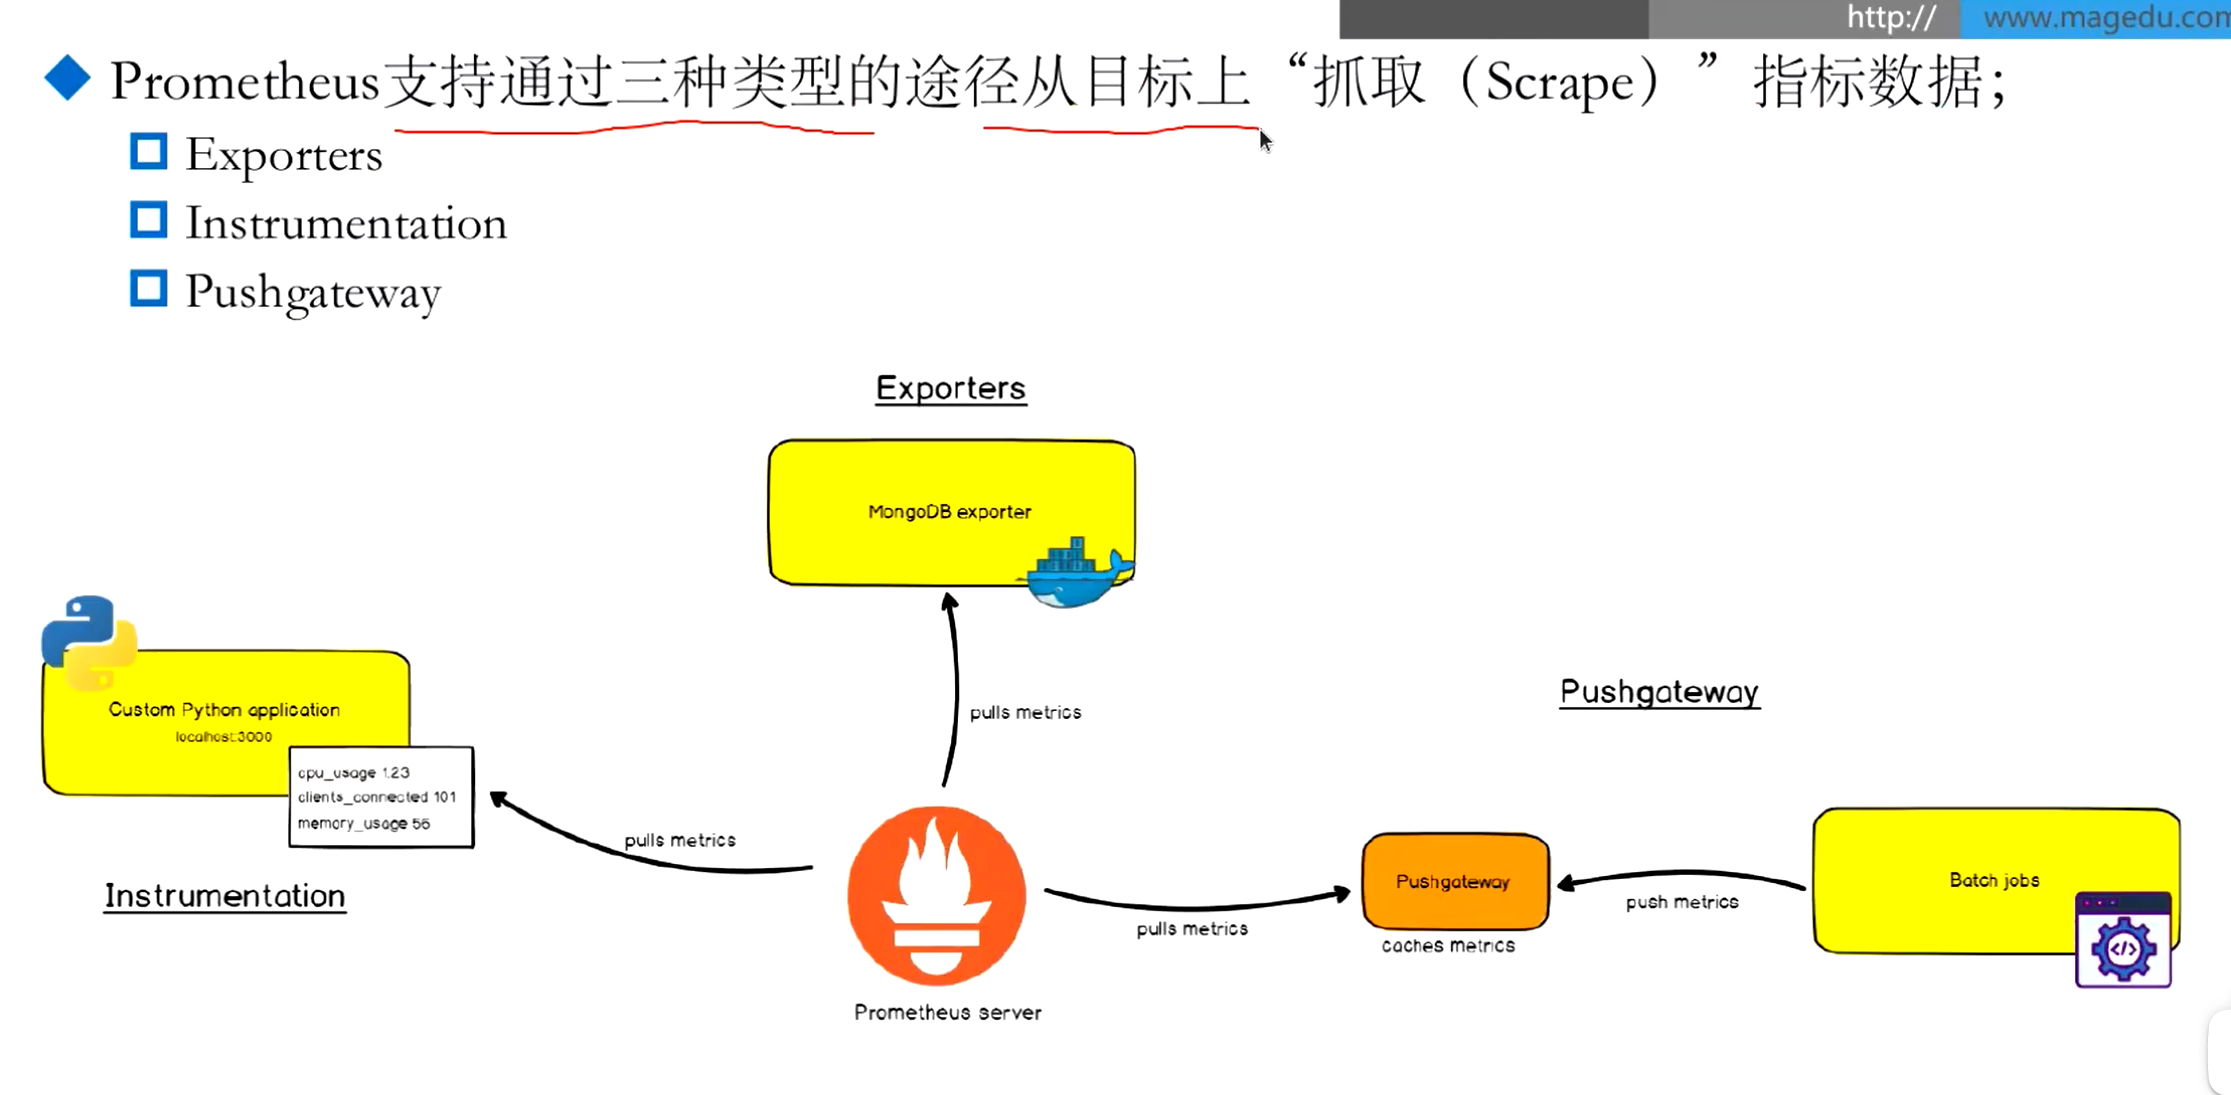

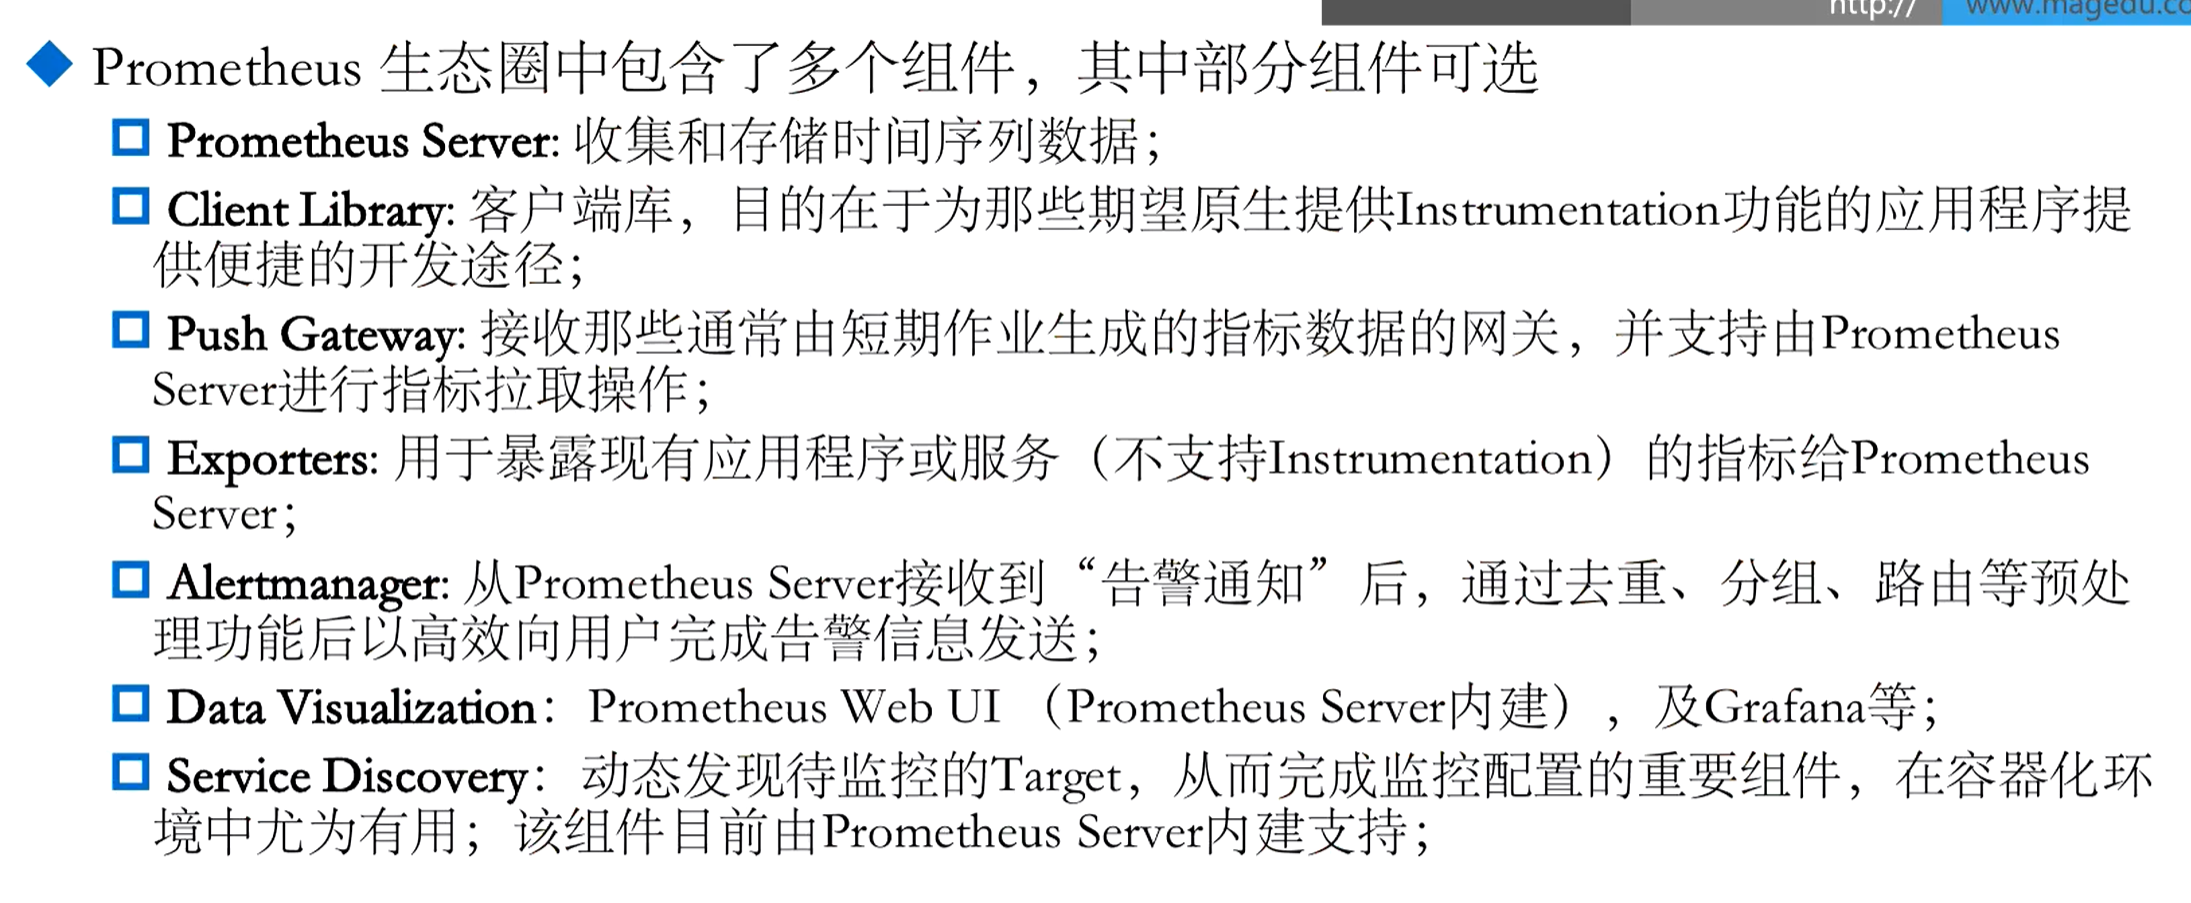
- Exporters
- 指标获取器,作为服务的客户端,采集原始指标,转换为prometheus格式的指标数据
- instructiontation
- 系统上报的指标符合prometheus的格式
- pushgateway
- 瞬时应用,上报指标
pull or push
prometheus 生态组件
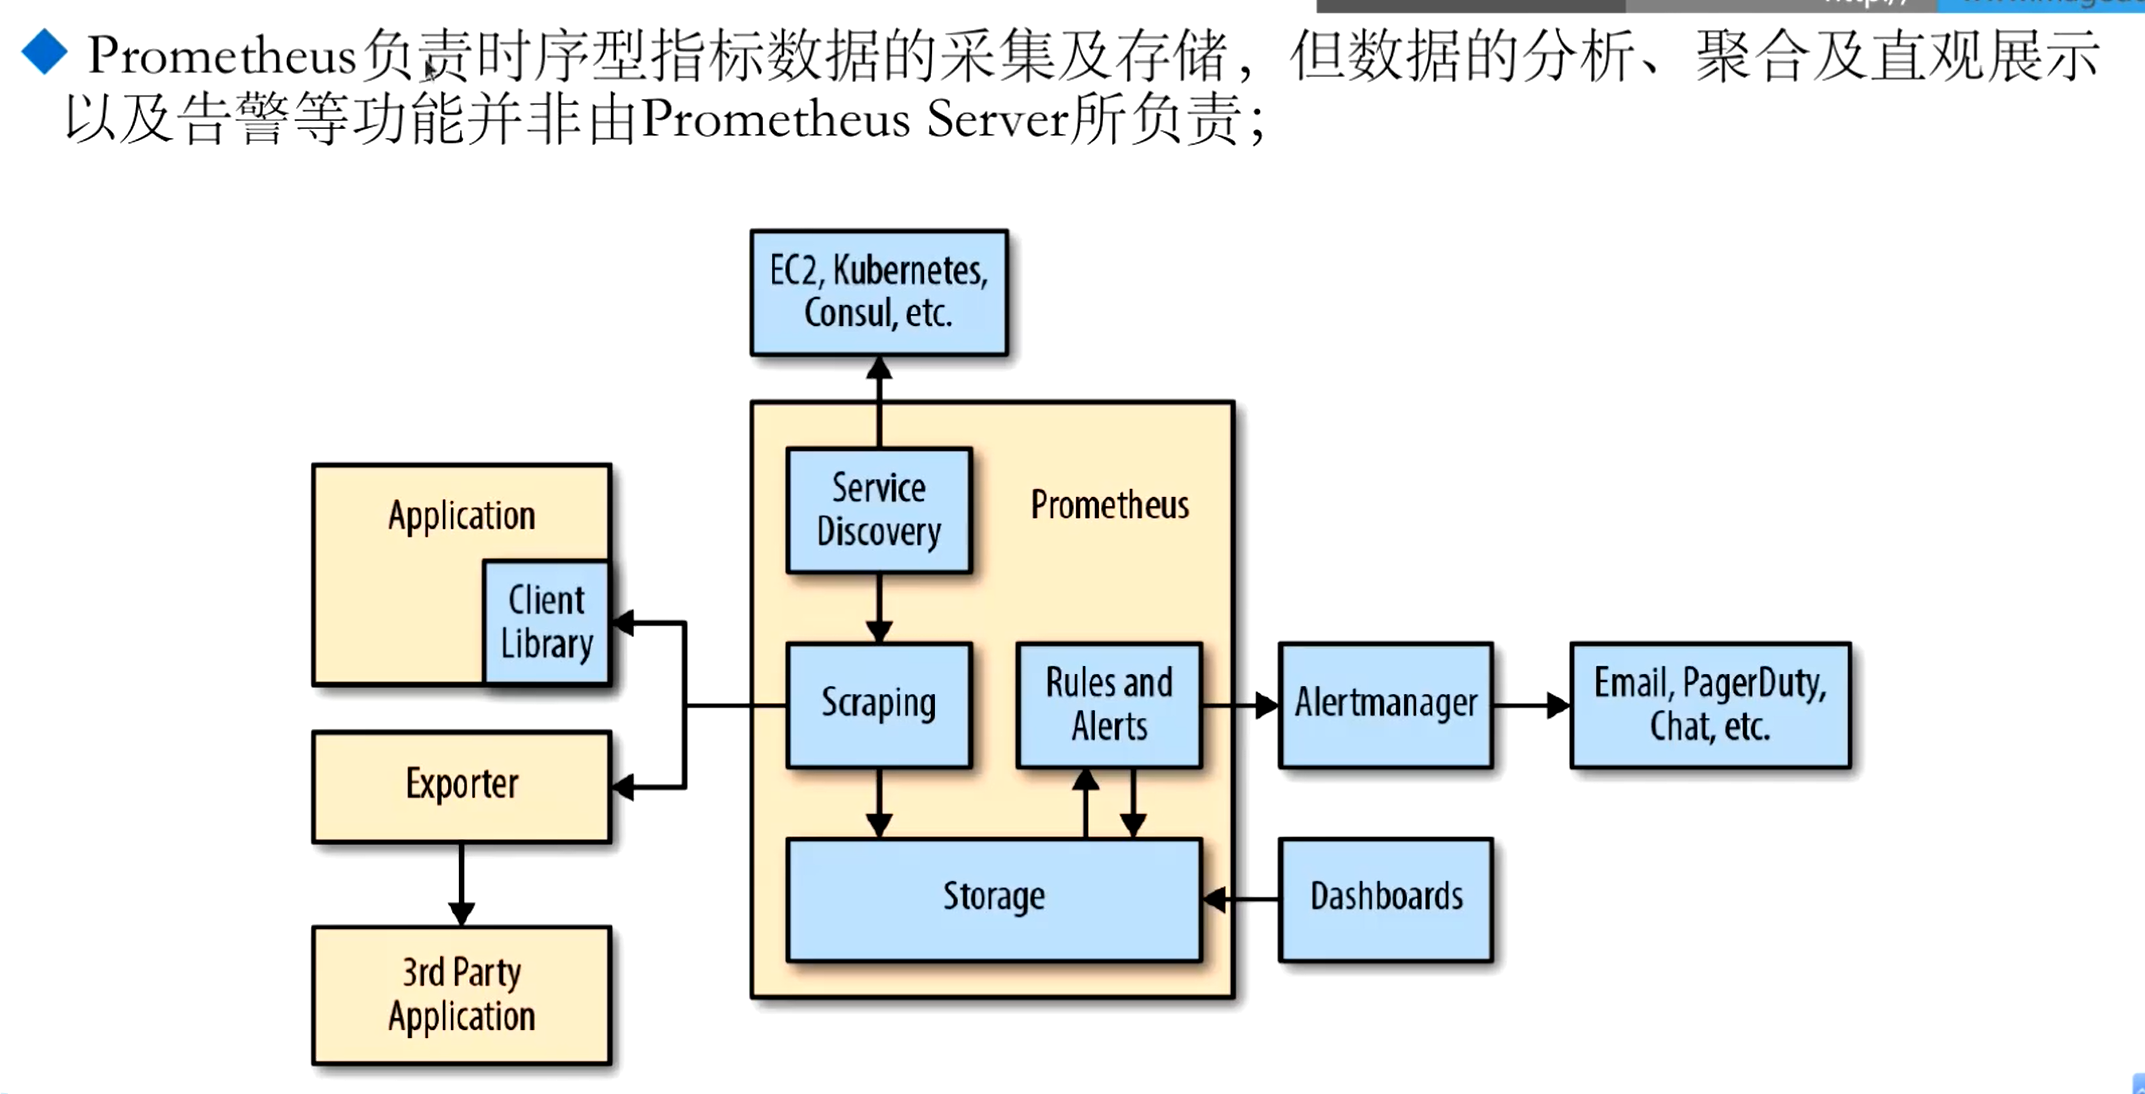
storage: TSDB 时序数据库
prometheus 数据模型

- 每个指标都会生成时序点
- 同一个指标比如cpu_usage,可能匹配三个甚至多台主机,用标签区分
指标类型

指标的数据格式:
作业(job)和实力(instance)

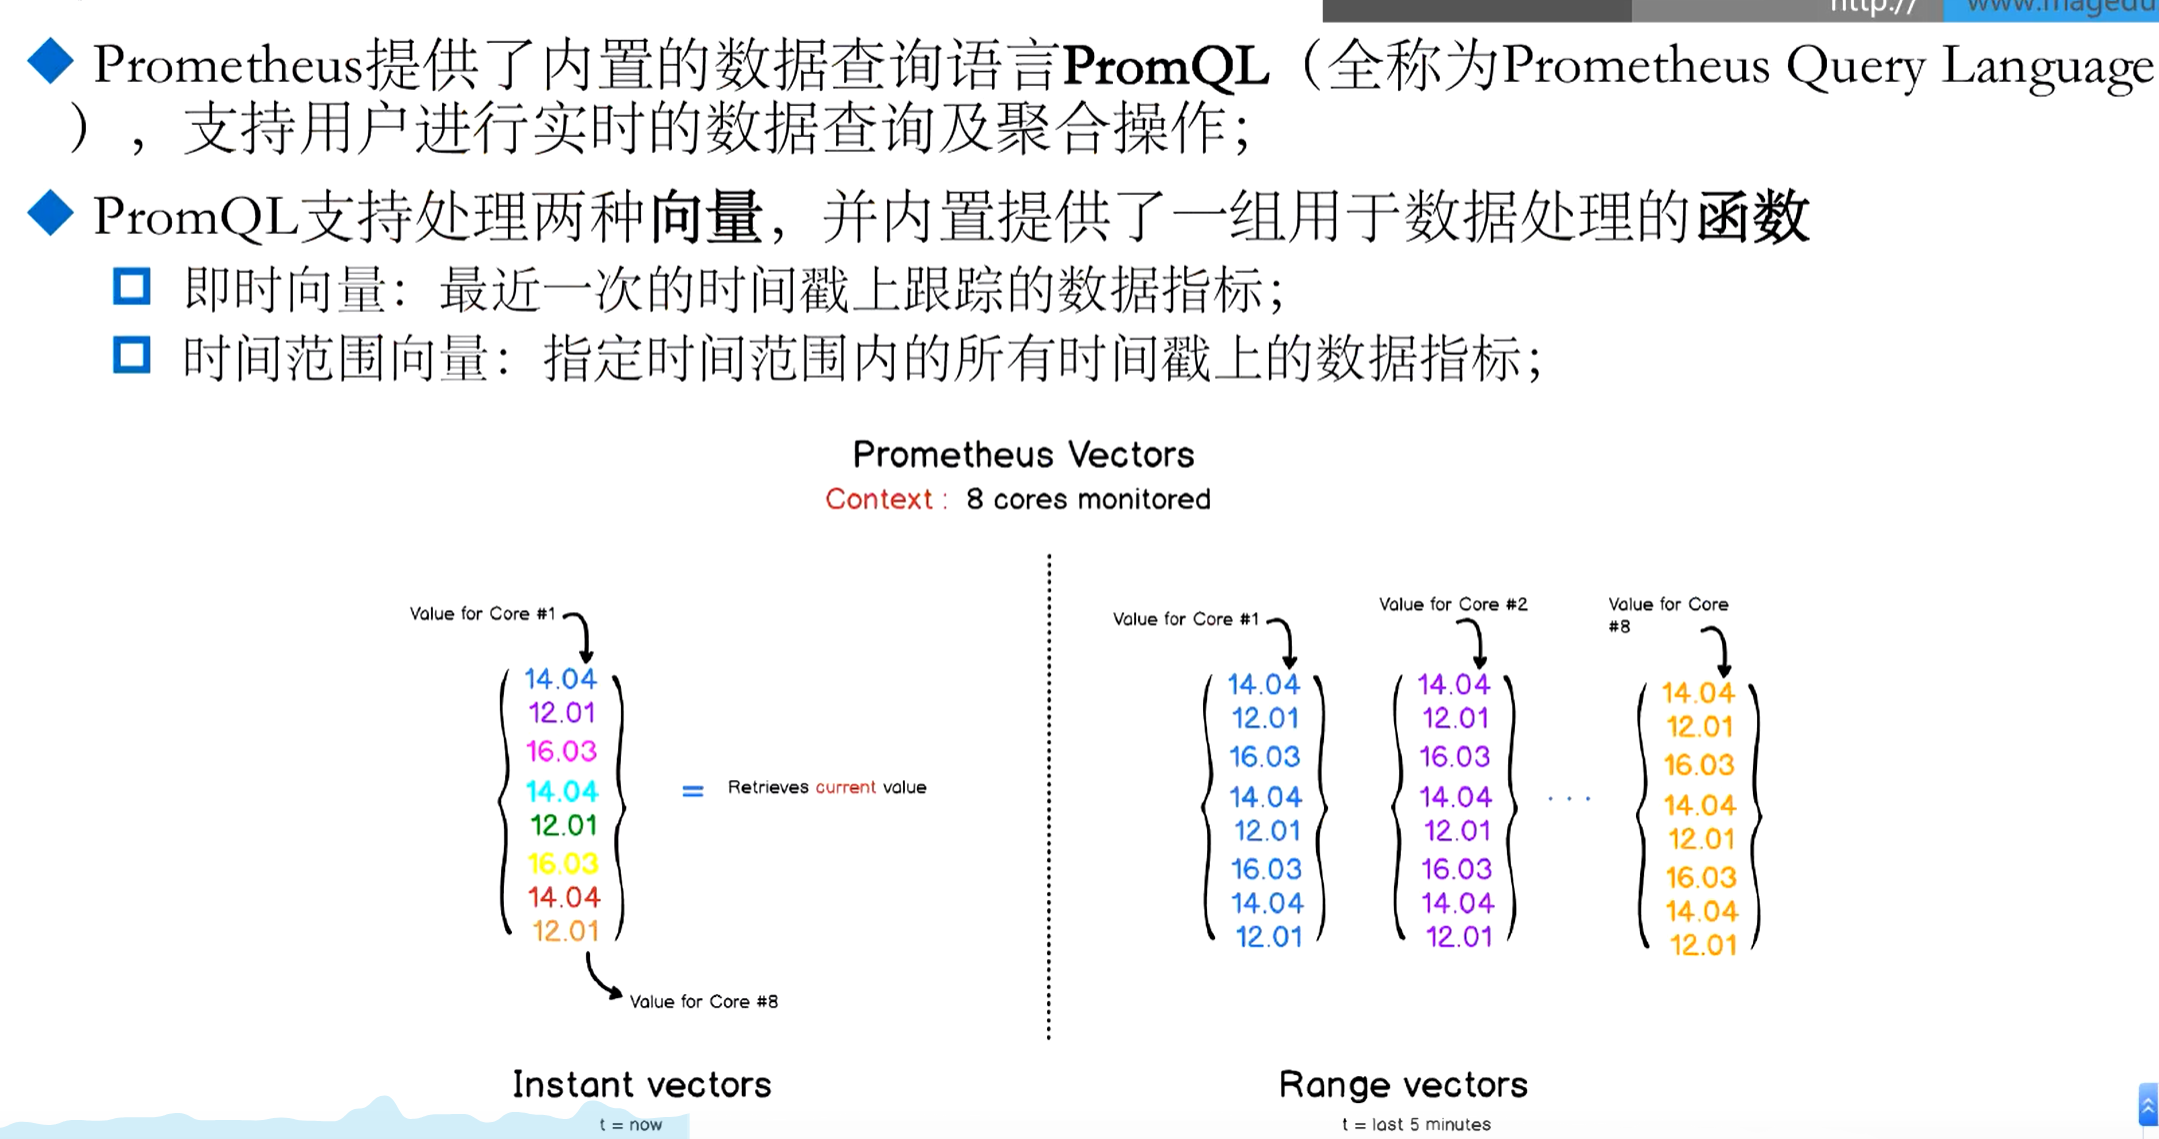
PromQL
Instrumentation (程序仪表)

Alerts

三 Prometheus 架构及组件